| |
 |
 |
Soil-Structure Interaction Effects in Floodwalls
Mete Oner, William P. Dawkins
Professors, School of Civil Engineering, Oklahoma State University, Stillwater, OK
Reed Mosher
Research Civil Engineer, Information Technology Laboratory, U.S. Army Engineer, Waterways Experiment Station, Vicksburg, MS.
and
Issam Hallal
Structural Engineer, Ralph M. Parsons Co., Pasadena, CA
|
ABSTRACT
Behavior of floodwall systems is studied by a comprehensive analysis procedure to understand the soil-structure interaction mechanisms involved in these systems. The procedure uses the finite element method equipped with suitable models of the soil-structure interface, nonlinear soil behavior, and loading sequence. A full scale test, performed by the New Orleans District, U.S. Corps of Engineers, on a test section near an existing levee was used for verification of the analytical model. The analytical tool permitted the study of a variety of floodwall/levee configurations to obtain information on the behavior of floodwalls leading to the development of improved design-oriented analysis procedures.
Keywords: Analysis, Soft Clays, Sheetpiles, Deformation, floodwalls, sheetpiles, soil-structure interaction, finite element method
INTRODUCTION
Flood protection along the Lower Mississippi River is usually provided by earth levees. Where the levee height is limited by weak natural soils, additional height is gained by sheetpiles driven into the levee crest to form a “floodwall” as illustrated in Figure 1. Traditionally, the required depth of a sheetpile penetration and the sheetpile section have been determined using classical design procedures for cantilever retaining walls. The classical design procedures are based on the assumption that the soil (after application of “factors of safety” or “strength reduction factors”) is capable of exerting full “active” pressure or full “passive” pressure at every point except for a hypothetical transition zone near the bottom of the pile. The lack of a good understanding of the mechanisms involved in floodwall systems has led to what appears to be a very conservative selection of the final design penetration. The continuing reconstruction of existing floodwalls and anticipated new construction indicate the need for improved design techniques.

Figure 1. Cross section of a typical floodwall (all dimensions in ft, 1 ft = 0.305 m)
The studies reported in this paper have been performed in two stages. The first stage concerns the development and verification of a comprehensive analysis procedure for floodwall systems. The analysis process involved the formulation of a two-dimensional model of the floodwall system including non-linear soil behavior and allowing for separation of the pile and the adjacent soil. Verification of the process was made possible by the nearly unique luxury of the availability of results of tests of a prototype system. The first half of this report focuses on the modeling and analytical techniques and a comparison of the analytical and prototype test results.
The techniques employed are shown to represent the behavior of a floodwall system. However, the finite element analysis procedure is impractical for use in design iterations. The second stage of the study involves the effects of parametric variations, principally soil shear strength, pile penetration, and levee geometry. The intent of these analyses will be to gain insight by providing detailed information on the behavior of typical floodwalls, and pave the way for the development of improved procedures for design. The unusual aspects of the calculated behavior are presented and discussed with this objective in mind.
TYPICAL SOIL PROPERTIES AT FLOODWALL SITES
Although exploration and testing of soils at a construction site are routinely performed, the soil data from any one site are rarely sufficiently complete to provide information regarding all system parameters which must be incorporated in a comprehensive analysis. To acquire a good understanding of the soils involved at floodwall sites, field and laboratory test data provided by private communication by the Corps of Engineers for several sites along the lower Mississippi River, results for the test site (8), and previously published data (1, 6, 7) were examined.
The soils along the lower Mississippi are generally medium to very soft, fully saturated clays generally classified as CH. Average properties of the clays are: water content, 64%; void ratio, 1.8; plastic limit, 30; liquid limit, 84; and liquidity index, 0.7. Undrained shear strengths, cu, for several sites are shown in Figure 2. All profiles indicate that the strength of the levee material is higher than that of the natural soil at the original ground surface (about 10 feet = 3 m below the levee crest). The strength of the natural soil immediately below the levee is only slightly lower than that of the levee and decreases to a minimum at about 20 feet (6 m) below the crest. The higher strength near the original surface suggests either some consolidation due to levee overburden and/or prior desiccation. Below 20 feet (6 m) the strength increases with depth in a manner typical of normally consolidated clays.

Figure 2. Idealized shear strength profiles with data from typical floodwall sites
(1 psf = 0.048 kPa, 1 ft = 0.305 m)
The nature of the soil and the short duration of a flood indicates an undrained (total stress) analysis. Values of the mid-point secant Young's modulus E50 (i.e., the secant modulus at 1/2 failure stress level) can readily be extracted from undrained triaxial stress-strain curves. Values of E50, as a function of cu, for the lower Mississippi soils are shown in Figure 3. The straight lines in Figure 3 suggest that E50/cu ratio varies between 50 and 350 with an average of 150. The average value has little real significance as there are few points around the average. Values fall primarily into two ranges: 50 to 100 and 200 to 350. The soil at the full-scale test site lies in the upper range. Correlations reported in the literature (1, 6, 7) show that the E50/cu ratio decreases with (among other effects) increasing plasticity index, over-consolidation ratio, and initial stress ratio. Because these latter effects do not change significantly during a relatively short term flood condition,the E50/cu ratio was kept constant for the analyses discussed in this paper. Because stress-strain curves were not available for soils at the test site, it was necessary to vary the E50/cu ratio to study its effect on the analytical results.

Figure 3. E50 versus undrained shear strength at floodwall sites
(1 psf = 0.048 kPa, 1 ksf = 48 kPa)
PROTOTYPE TEST
An instrumented test of a full scale sheet pile wall subjected to the effects of increasing water loads was conducted by the Corps of Engineers on a test section constructed near an existing levee. Details of the tests and instrumentation are reported in Ref. 8. Conditions at the test site are shown in Figure 4. A sheet pile (PZ-27) wall, 200 feet (61 m) long, was driven into the landside berm of the “Item E99,” East Atchafalaya Basin protection levee just south of Morgan City, Louisiana. The piling had an exposed height of approximately 10 feet (3 m) and was driven to an embedment of approximately 23 feet (7 m). (The ground surface parallel to the long dimension of the wall was not perfectly horizontal). Water was ponded between the levee and the sheet pile in four stages over a period of two months, simulating a flood condition. Measured effects at four locations along the wall included strains in the sheet pile, pile head deflections, soil displacements indicated by inclinometers and site survey, and pore pressures indicated by piezometers. Although the test configuration does not duplicate an actual floodwall system, it does provide a means of comparing experimental and analytical results for the interaction of the sheet pile, soil and water.
Subsoil exploration at the site indicated a strength depth profile somewhat similar to those for natural soils at the other sites discussed previously. With the exception of an anomalous stiff layer centered about 9 feet (2.7 m) below the surface, the soil strength increased with depth. The idealized soil profile for analysis extracted from data reported in Ref. 8 is given in Table 1.
Table 1. Idealized Soil Profile at the E99 Wall Site
 |
Elevation
Range |
Layer
Thickness |
cu |
Unit Weight |
 |
(ft) |
(ft) |
(psf) |
(kPa) |
(pcf) |
(kN/m3) |
6.5 to -1 |
7.5 |
200 |
19 |
104 |
16.3 |
-1.0 to -5 |
4.0 |
500 |
48 |
107 |
16.8 |
-5.0 to -14 |
9.0 |
350 |
33 |
106 |
16.7 |
-14.0 to -19 |
6.0 |
500 |
48 |
104 |
16.3 |
-19.0 to -29 |
10.0 |
500 |
48 |
101 |
15.9 |
-29.0 to –44 |
15.0 |
550 |
53 |
100 |
15.7 |
 |
(1 ft = 0.305 m)
|
 |
Stress-strain data were not available for the soils at the E99 site. Consequently the E50 /cu ratio could not be directly evaluated. Because of the similarity of the E99 soils and other sites, the ratio is expected to be in the range of 150 to 350 as discussed. Subsequently, sensitivity analyses were performed to investigate the influence of the parameter.
The original plan (Ref. 8) was to raise and then lower the water level in steps to simulate a flood hydrograph for the test location. Displacement time histories of wall deflections at the four instrumented sections are given in Ref. 8. Displacements at the four sections closely followed the rising water level up to a nominal head of 6 feet and remained essentially constant as the water level remained constant. When the level was raised to 7 feet (2.1 m), displacements at sections C and D (Figure 4) stabilized after a few days. However, at sections A and B displacements were still increasing after 15 days. When the head was increased, deflections at all sections were still increasing after nine days with a high rate at Section A and progressively lower rates at B, C, and D. On the ninth day at an 8-foot (2.4 m) head, seals in the wall ruptured, allowing the ponded water to drain rapidly.

Figure 4. Plan and profile of E99 test wall (Ref. 11)
Rupture of the seals was initiated by very large displacements near Section A. Due to the sloping surface parallel to the wall, the effective water head at A was approximately six inches greater than the nominal and the effective embedment depth was reduced by six inches. In addition, during site preparation, fill was placed on the natural ground surface and the strength of this temporary fill was probably lower than that of the natural soil. While these variations are not significant for low heads, they combine to aggravate conditions at impending failure.
Some of the results of the E99 test reported in Ref. 8 are presented for comparison with analytical solutions later in this report.
GEOMETRIC MODEL
A two-dimensional model of the system was developed which included the following characteristics:
1. Representation of the soil by isoparametric quadrilateral finite elements in plane strain.
2. Representation of the sheet pile by linearly elastic, one-dimensional beam-column elements.
3. Representation of the soil/pile interface by special point interface elements.
4. Provision for imposing additional hydrostatic pressures on both faces of a “tension crack” should it develop and water intrude the crack.
Point interface elements are used to connect soil and pile nodes along the pile/soil interface. The interface elements (originated by Ngo and Scordelis (13) and refined by Wilson (18)) allow soil and pile nodes to separate under tension (i.e., permitting a “tension crack” to develop), enforce compatibility of soil/pile nodal displacements without intrusion under compression normal to the interface, and permit representation of friction/adhesion parallel to the interface as a function of relative soil/pile displacement under compression normal to the interface. Solutions were obtained in which the tangent stiffness and the ultimate fraction stress permitted by the interface element were expressed as various combinations of soil strength and stiffness as well as a coefficient of friction applied to the normal interface compressive stress. It was found that relative motion between the soil and pile parallel to the interface occurs only in an isolated region near the ground surface ahead of the pile, and that neither the frictional stiffness nor the limiting friction force had any significant effect on the response of the entire system. Therefore, a rigid-plastic model was used for the frictional component of the interface element with the limiting friction being set equal to the one-tenth of the soil shear strength at each point.
SOIL CONSTITUTIVE MODEL
Numerous soil constitutive models have been proposed (e.g., see Refs. 4, 5, 9, 10) and applied to the analysis of soil behavior with varying degrees of success. Many of those require an intimate knowledge of the soil properties in order to evaluate all of the parameters to be included in the model. Ideally, the constitutive model would be one which was developed for the conditions of the system being analyzed, particularly the predominant stress paths involved. For the purposes of this work the model was selected for simplicity while still maintaining the essential characteristics of the soil behavior. The characteristics found essential here are:
1. A representation the decrease in soil stiffness as the material approaches failure upon monotonic loading.
2. A reasonable representation of soil stress-strain behavior under stress reversal (unloading-reloading).
3. The physical meaningfulness of the model parameters and relatability of the parameters to common engineering properties of the soil.
The “Degree of Mobilization” or “f-Model” (9, 14) was selected for use in this study. The f-Model employs the usual plain strain, stress-strain relationship expressed in terms of a tangent shear modulus, G, and a tangent constrained modulus, M. The two are related by Poisson's ratio, n, in the well known manner. In this study Poisson's ratio was held constant throughout at 0.49 to reflect the incompressibility of the soft undrained clays present in the floodwall system.
Decreasing soil stiffness as failure approaches is imposed by expressing the shear modulus, G, as a function of the “Degree of Mobilization,” f. For the undrained condition f is simply
 |
(1)
|
The shear modulus variation with f for monotonic (primary) loading is expressed as
 |
(2)
|
in which G0 is the shear modulus, and f0 is the degree of mobilization at the K0 condition. Alternatively, Eq. (2) may also be written as
 |
(3)
|
where Gi, the “initial” modulus, is the shear modulus at the isotropic stress state.
The initial shear modulus, Gi, is related to the initial Young's modulus assuming
n = 0.5; Ei = 3 Gi, which in turn can be related to mid-point secant modulus, E50, as shown in Appendix I,
 |
(4)
|
which establishes a useful relationship for obtaining the required model parameter (Ei or G0) from the available experimental data (E50).
The stress-strain response to load reversals is especially critical for the problem being studied since the passive stress region in front of the pile is one of the major factors that determine the behavior of the pile. The unloading-reloading stress-strain behavior is modeled by the method generally known as “Masing’s Rules” (12). According to this method, upon unloading the material regains its initial stiffness and for subsequent loading in the reversed direction the stress-strain relationship follows a curve obtained by scaling the virgin curve. The adaptation of Masing’s Rules to f model is illustrated in Figure 5 for simple shear condition.

Figure 5. Shear stress-strain model utilizing Masing's criterion
For monotonic loading along A-B-C, the shear modulus is given by EG at B:
 |
(5)
|
If strain reversal occurs at B, the shear modulus reverts to its initial value, G0. For continued reversal along curve B-D-E, the shear modulus is obtained from
 |
(6)
|
utilizing the same basic form (Eq. 3) but with f modified to represent the scaling;
 |
(7)
|
With this implementation of Masing's Rules the stress-strain curve never exceeds failure.
The constitutive relation for the soil described above was found to simulate dominant (active and passive) stress paths obtained from undrained triaxial tests of soils contained in the floodwall system (15).
Alteration of Constitutive Model During Loading
Dependence of the soil stiffness on stress state requires that the soil shear modulus, G, assigned to an element be representative of the stress state during application of each loading increment. A frequently used procedure (the “initial modulus” method) is to assign stiffness parameters for each succeeding increment equal to those existing at the end of the preceding increment. Unless myriad small loading increments are used, this approach results in divergence of the predicted response from the true behavior. An equally unpalatable alternative is to perform numerous in-step iterations. To obtain good numerical accuracy for the relatively small number of loading steps described above, a simple and stable “acceleration” algorithm was devised. At the end of each increment, the degree of mobilization f0 and the change Df which occurred during the load increment are recorded. The shear modulus for the next step is then evaluated from Eq. (4) for a modified mobilization factor f1, where
 |
(8)
|
where a is an “acceleration” factor such that 0 < a <1 (a = 0 corresponds to the “initial modulus” method). Examination of the shear stress-strain behavior suggests that the decay in shear modulus for low values of f should be small. As stress levels approach failure, the shear modulus decays rapidly with increasing f. Hence near failure a should be large, thus accelerating the decay. Numerical experimentation with various schemes indicated the simple expedient of using a = f0 produced accurate and reliable results.
ANALYSIS OF E99 WALL
The geometric model consists of 343 elements and 386 nodes, the mesh being finer in the vicinity of the wall. Other aspects of the analysis are briefly described below, followed by a discussion of the results.
Initial Stresses
The dependence of the soil stress-strain behavior at any point on the stress state at that point requires that the initial system stresses be determined before the effects of any changes can be considered. If the ground surface were horizontal, the initial stress state in each element would be simply calculated from the weight of the overlying soil or from a “gravity turn-on” solution. An attempt to estimate initial stresses for the E99 system resulted in spuriously high stresses at discontinuities in the irregular ground surface at the toe of the levee and attendant displacements suggesting erroneously that the soil system was failing under its own weight. These anomalies were eliminated by estimating the initial stresses in two steps. A gravity turn-on analysis for the weight of the elements below natural ground was performed first and the weight of the levee elements was added as an initial load on the nonlinear system.
Incremental Loading
The rising water level produces several loading effects on a flood wall system. Most apparent is the hydrostatic pressure on the exposed wall above the ground surface. This part of the loading is independent of system deformations. As a result of the undrained deformation assumption, water loading is also imposed on the ground surface between the wall and the face of the levee. Due to the sloping ground surface, both vertical and horizontal components of water loading act on the soil mass. This contribution to the total loading is also independent of system deformation. As the water level rises,the increased loading may produce separation of the soil from the pile on the flooded side (i.e., a “tension crack” develops behind the wall). Intrusion of free water into the tension crack produces additional hydrostatic pressures on the wall side of the crack and equal and opposite pressures on the soil side of the crack. This part of the loading is a function of system deformations.
In the simulation of the E99 wall test, the water level was increased in 17 basic steps (four increments of 1 foot (0.305 m), followed by three increments of 0.5 foot (0.15 m), and concluding with ten increments of 0.25 foot (0.076 m)) up to a total head of 8 feet. (Note: The description of the tests (8) reports maximum heads ranging from 7.8 ft. to 8.3 ft (2.38 to 2.53 m) at the four instrument sections on the wall due to the sloping ground surface parallel to the wall.) The analysis for each loading increment was initially performed using the conditions of the tension crack at the end of the preceding increment. If additional propagation of the tension crack was indicated during the basic loading increment, that increment was further subdivided (typically into three substeps) with attendant alterations in water loads on the crack surface.
Soil Model Parameters
In the following paragraphs the results of the analysis using the techniques described above are compared with experimental values. Because stress-strain curves were not available for soils at the E99 site, it was necessary to obtain solutions in which the principal parameter E50/cu was varied within the expected range from 150 to 350. Values of E50/cu in the vicinity of 200 to 300 provided the best correlation with test results. Comparisons are E50/cu of 200 and 300 are discussed below and detailed studies of system behavior are reported for E50/cu equal to 200.
System Deformation
Analytical and experimental results for the deflection of the top of the pile relative to the pile bottom for increasing water head are shown in Figure 6. While the solution with E50/cu = 300 provides a slightly better approximation of behavior for a water head up to approximately 7 feet, the more flexible system with E50/cu = 200 more closely represents conditions approaching failure. It should be noted that the difference of the results of the two cases is smaller than the scatter of the experimental results.

Figure 6. E99 wall top deflection relative to the bottom of the pile. (1 ft = 0.305 m, 1 inch = 25.4 mm)
Measured and calculated displacements along the pile and in the soil 4 feet (1.2 m) in front of the pile for all water levels compare equally well (detailed results are given in Ref. 15).
Bending Moments
Measured and calculated bending moments in the pile are shown in Figure 7. As should be expected, curves for calculated bending moments indicate that the solution for moments is relatively insensitive to the soil stiffness represented by the value of E50/cu. The wide scatter of measured moments is in part due to the near ultimate conditions existing at wall sections A and B at this water head.
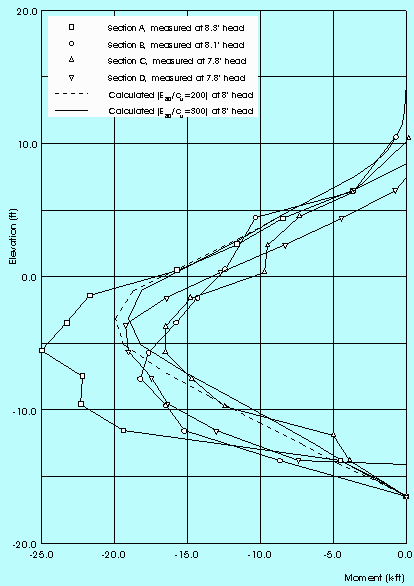
Figure 7. E99 wall: comparison of measured and calculated bending moments
Soil Strength Mobilization
Contours of the calculated degree of mobilization f, here (max/cu, have been plotted at various stages of the test, especially in the vicinity of the pile (Ref. 15). The maximum f values occur in the “passive” region (in front of the pile, near the ground surface). At 8 ft head, the degree of mobilization in this region reaches 80% to 90%, but in only a limited depth, less than 5 ft (1.5 m). Another locally critical region is found behind the wall, above the pile tip level. In this area, f reaches only 60% to 70%. In other areas, f remains in the range of 30% to 50%. Even though catastrophic collapse of the wall is imminent under the 8-foot head, judged by the rapid build-up of deformation (Figure 6), the soil is not loaded to failure.
TYPICAL FLOODWALL ANALYSES
The second part of this investigation involves analyses of typical floodwall sections using the technique described above. Data were supplied by USAE Waterways Experiment Station on typical Corps of Engineers floodwall sites in the lower Mississippi basin. It was observed that levees are typically about 10 ft high, and generally have side slopes of 1:4. It was also observed that the soils encountered at floodwall sites are almost exclusively very soft to medium, highly plastic, saturated clays (CH). The undrained shear strength of these soils varied with depth as shown in Figure 2. This variation allowed an idealization where the natural soil exhibits a linear cu increase with depth after some minimum point at about 10 ft from the original ground surface (Figure 2). A lower and an upper boundary were originally selected for parametric studies. However, initial studies have shown that significant portions of the foundation soil approached failure under the levee weight before even the flood load was applied. Consequently it was decided to consider the upper boundary and an average line between the two boundaries. These strength profiles are frequently referred to as the “medium strength profile” and the “high strength profile” in the following paragraphs.
Three pile penetrations were selected for parametric studies: 10 ft, 20 ft, and 30 ft, measured from the levee crest. These cases are referred to as “the 10 ft pile, 20 ft pile,” etc. in the following. The shortest (10 ft) pile is entirely in the levee, and the other two penetrate the natural soil. Flood levels of up to elevation 16' (i.e., 6 ft above the crest) were considered.
Finite Element Grid
The finite element grid used, shown in Figure 8(a), is 100 ft high, and 270 ft wide. Figure 8(b) shows the details of the grid in the vicinity of the pile. The finite element model consists of 542 elements and 539 nodes.
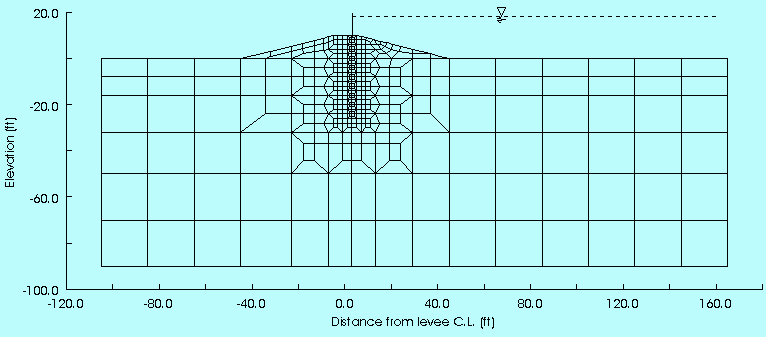
Figure 8. (a) Grid used for typical floodwall analyses (1 ft = 0.305 m)
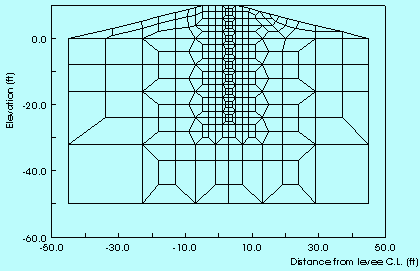
Figure 8. (b) Details of the grid used for typical floodwall analyses (1 ft = 0.305 m)
Mesh fineness and lateral grid dimensions appeared to be adequate judging from the computed stress distributions that give contours that tend to become horizontal towards the side boundaries. The grid depth, 90 ft from the original ground surface, is smaller than the other dimensions; therefore its effect was investigated by one run in which the depth was increased to 150 ft. A comparison of the two cases indicated that the moments in the pile and the stresses in the soil in the vicinity of the pile remain unchanged. The absolute displacements increased somewhat with increased grid depth, but the pile deflections relative to the pile tip were essentially the same. Since the main concern is in the system behavior in the vicinity of the pile, the original grid was considered satisfactory.
Initial Stresses, Loading, and Parameters Used
To determine the initial state of stress in the soil a three step “gravity-turn-on” analysis was done. The first step was the level ground, and the levee was “built” in two steps.
Loading of the system, representing a flood, was imposed in 2-ft steps until the water elevation reached the levee crest and in 1-ft increments thereafter up to 16 ft of head.
The parameters used are those that were found satisfactory in the first phase verification studies. The most predominant parameter of the technique (other than the shear strength), E50/cu ratio, was selected as 200. The properties of the sheet pile are those of PZ-27 section.
RESULTS OF THE ANALYSES
Degree of Mobilization
The degree of mobilization, f, of soil shear strength is used to study the soil behavior. The conditions before flood loading in the 30-ft pile in high strength soil are shown in Figure 9. It is observed that f varies between zero near the ground surface and about 60% below the levee. The concentration of the highest f values in that area seems to be a result of the combination of two factors; (a) the occurrence of the lowest shear strength at that level, and (b) a lateral spreading tendency due to the weight of the levee that decreases the horizontal stresses in that area. The initial f contours for the medium strength case are quite similar in general apperance, but the maximum f is approximately 80%.
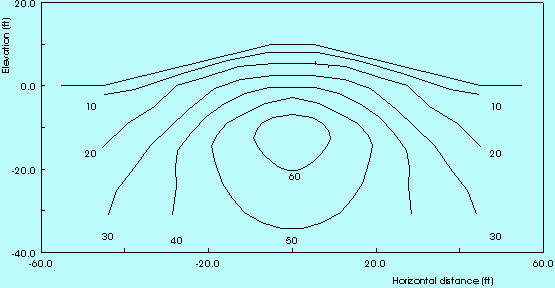
Figure 9. Initial degree of mobilization, f, (%) contours, high strength profile (1 ft = 0.305 m)
As loading progresses f contours shift slightly to the right, without appreciable changes until the water level reaches the levee crest. Up to this point the effect of pile penetration on f distribution seems to be insignificant.
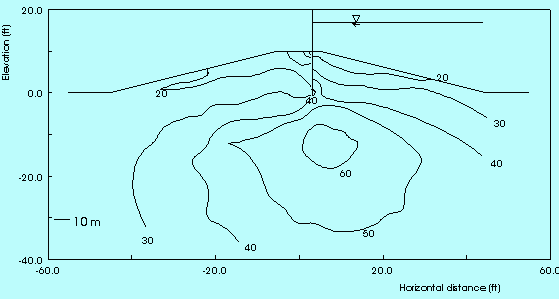
Figure 10. Degree of mobilization, f, (%) contours at 16 ft head, high strength profile, 10 ft pile
(1 ft = 0.305 m)
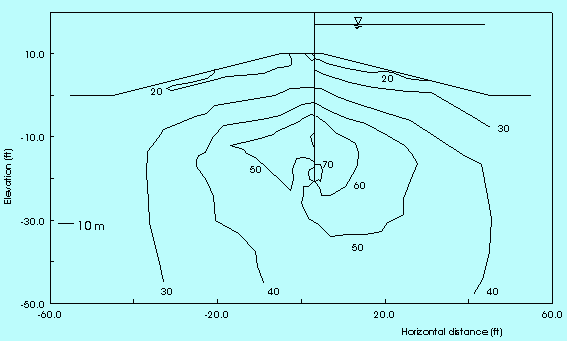
Figure 11. Degree of mobilization f, (%) contours at 16 ft head, high strength profile, 30 ft pile (1 ft = 0.305 m)
At higher water levels the effect of pile penetration becomes apparent, as shown in Figures 10 and 11 for the high strength case, 10-ft and 30-ft piles, and in Figure 12 for the 10-ft pile for the medium strength case, at the final, 16 ft head. At 16 ft head f values have increased between 10% and 30% relative to the initial condition. These increases occur mainly within few feet of the pile; especially (a) around the tip and (b) near the crest on the front side. A tendency towards a passive type failure is observed in the latter area, but it is confined to a very small region, and the f values are still very far from failure. The middle portion, between this passive zone and the tip of the pile, there is actually a drop in f. This is due to an increase in the horizontal stress, while the vertical stress remains essentially constant.
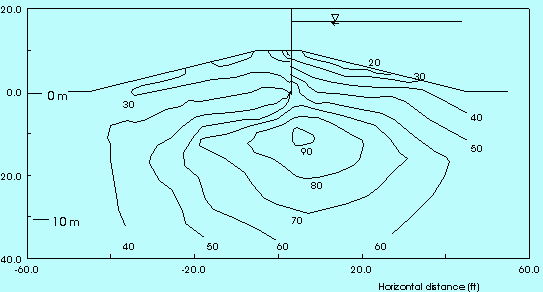
Figure 12. Degree of mobilization, f, (%) contours at 16 ft head, medium strength profile, 10 ft pile (1 ft = 0.305 m)
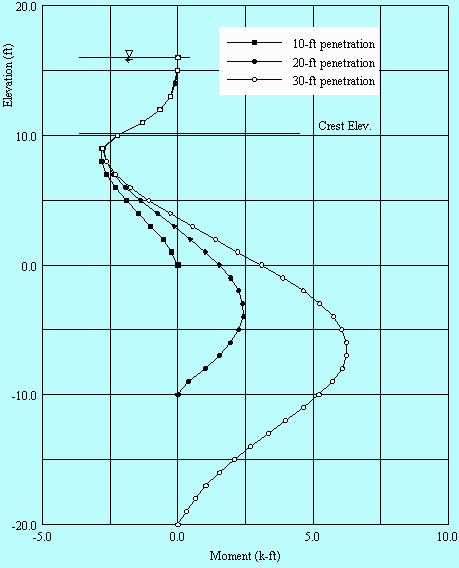
Figure 13. Bending moments (High strength profile, water head: 16 ft)
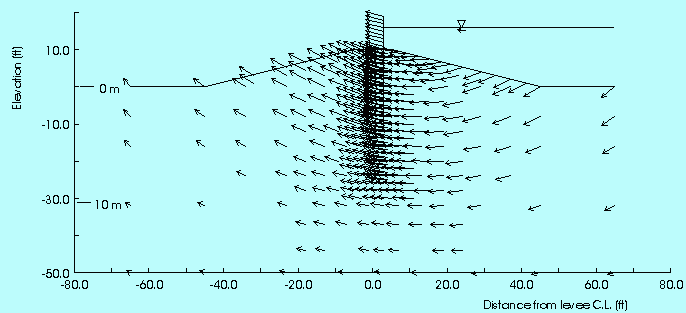
Figure 14. Deformation of the floodwall at 16 ft head, high strength case, 20-ft pile (1 ft = 0.305 m)
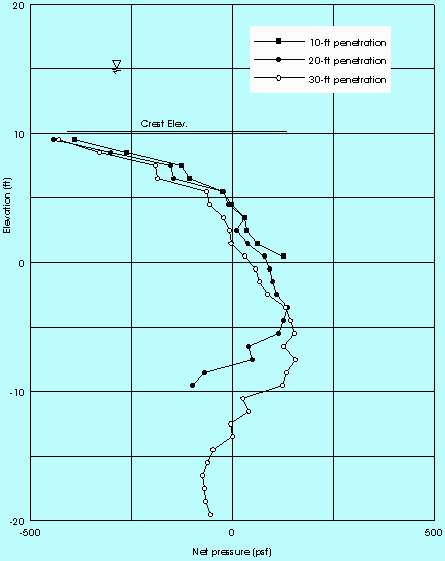
Figure 15. Net pressures on piles at 15 ft water head (high strength profile)
Any other tendency towards the conventional active-passive failure profile (i.e. a reversal of active and passive conditions at some depth close to the pile tip) is not observed, except in the 10 ft pile case. In all six cases f increases around the pile tip on both sides. In the 20 ft and 30 ft pile cases these changes occur mainly due to horizontal stress changes that are the opposite of what conventional active-passive model assumes (see Figure 15).
It may also be noted that the highest changes in f in this zone (near the tip) occur in the 20 ft pile cases. This may be attributed to the fact that the pile tip rests in the weakest soil layer. This weak layer affects the f contours at 16 ft head in all cases. Note, for example, the leftward extension of the f = 50% contours in Figs. 10 through 13. It is interesting to note that this contour shape is practically unaffected by pile penetration. A closer examination reveals that this is true for most of the f contours and the effect of pile penetration on soil behavior is confined to the immediate vicinity of the pile.
Pile Deflection and Bending
The moment diagrams for the high strength profile are shown in Figure 13, for three pile penetrations, at 16 ft head. For the 10 ft case only negative moments develop in the pile, as a conventional active-passive model would indicate. For the deeper piles, however, a considerable positive moment develops in the pile. In these cases the positive moment can be several times larger than the maximum negative moment at lower water heads.
The negative moments may be thought of as extensions of those due to the hydrostatic loads on the free segment of the pile above the crest; as the soil near the crest in front of the pile yields in a “passive” sense, this moment increases up to a certain depth and then starts decreasing as the soil reaction increases with depth. The moments in the 10 ft case can be explained by the conventional active-passive model. Being short, this pile is effectively stiffer than the longer piles, and it seems to be able to produce an effect similar to the assumed classical rigid body rotation and the accomapnying reversal of active and passive conditions at some depth.
The 20 ft and 30 ft piles are more flexible; rather than rotating as a rigid body and displacing the soil around them, they tend to follow the deformation of the soil. Since the soil deforms mainly in a lateral shear, the lower parts of the piles are bent “backwards.” This bending causes the positive moments. This also explains the peculiar horizontal stress changes observed around the tip (there is an increase in the pressure in front of the tip and a decrease behind).
Deformation of the System
Figure 14 illustrates the deformation (with an exaggeration factor of 500) of the system for the 20 ft pile in the high strength profile at a 16 ft head. The most striking aspect of the deformations is the indication that the entire levee system is umdergoing essentially rigid body rotation about some point above the crest of the levee. The apparent rigid body motion was observed for both soil strength profiles and appeared to be relatively insensitive to pile penetration.
Overall Deformation
Figure 15 illustrates the progressive displacement of the sheet pile with increasing head for the three pile penetrations in the medium strength profile. These displacement profiles indicate, for the 10 ft and 20 ft penetrations, the piling is essentially floating in the rotating soil mass without significant bending until the water begins to impose on the exposed height. The profile for 30 ft of penetration indicates that the piling is offering some resistance to soil motion near the bottom of the wall. As the water begins to act on the exposed height of the wall there is some tendency toward a reversal of curvature, however, the predominant rotation of the piling is clockwise sense at all levels of head as opposed to the counterclockwise rotation assumed by the conventional design procedure. It should be noted that the total lateral displacement of the pile head is essentially independent of the pile penetration. Displacement profiles for the high strength soil profile show the same trends except that the displacements are smaller (pile head displacement at 16 ft of head is approximately 2 inches or 5 cm).
Pressures on the Pile
The net lateral stress distributions at 15 ft water head in high strength soil are plotted in Figure 16 for the three pile penetrations. Looking only at the 10 ft pile case, one might conclude that the system behaves reasonably close to what is conventionally assumed: there is passive pressure development in front of the pile near the surface (and active behind), and this reverses towards the pile tip. The deeper piles, however, show once again that this may not always be the case; instead of the pile tip pushing the soil backwards (flood side), the soil pushes the pile in that direction. The soil pushes the pile to the left in the mid-span, and the soil near the tip reacts to the forward movement of the pile.
A comparison of the 10 ft case with the other two cases (Figure 15) seems to indicate that the earlier observation, that the 10 ft pile behaves as it is normally assumed in conventional analyses, may not really be the case. The net pressure diagram for the 10 ft pile is essentially the same as the top half of that for the 20 ft pile, or the top one-third of the 30 ft pile. Only small variations are observed around the pile tips in each case. Thus the behavior of the 10 ft pile may be interpreted as “accidental.” In all cases, the pile seems to be deflecting as the deformation of the soil dictates.
Soil Response Curves
One of the original intentions of the study was to explore the possibility of deriving “p-y” curves relating the wall pressure to displacement. Such curves could be used in one-dimensional “soil-structure interaction” (SSI) methods derived from beam on elastic foundation analysis (2,3), leading to an economical design-analysis method. Wall pressure-displacement curves were extracted and plotted for all six cases analyzed. These are presented in Ref. 14 for documentation purposes. If one attempts to compute an equivalent spring coefficient from these results excessively low values are obtained relative to those recommended in the literature (e.g., 17). This is due to the large overall deformation of the system, which obscures the interface behavior. It is the relative displacement between the pile and the soil, or the tendency of it, that should be related to the contact pressure, but separating this from finite element results is not practical. When the overall deformation is very large compared with the relative displacements the interpretaton of wall pressure-displacement relationship looses its meaning.
Discussion
The results of the finite element analyses indicate that the soil structure interaction effects in typical floodwalls produce a peculiar behavior; piles are bending “backwards,” causing positive moments larger than the “normal” negative values. It is unlikely that these effects can be predicted accurately by customary methods which are constructed on the basis of the assumption that a pile is stiffer than soil, so it will lean forwards and rotate when loaded, thus creating active and passive pressures in the soil. According to customary assumptions, the soil only reacts to the deflection of the pile, which is the dominant element of the system. However, it appears that the dominant element in a floodwall is the soil, and the pile is the follower.
This conclusion is unfortunate in the sense that it does not seem possible to use either the conventional (active-passive) sheetpile analysis method nor the conventional SSI method for the floodwall problem. On the other hand, it is very fortunate that the limitations of the current methods have been discovered, and this has opened the way for the improvement of our design-analysis methods.
CONCLUSIONS
Typical floodwall sections have been analyzed by a plane strain finite element method tailored for the purposes of this study. The results of the analyses have revealed that a typical floodwall will not behave as it is usually assumed in a conventional sheetpile design-analysis method (similar results were found in a later study by Leavall et al., 11). The overall deformation of the system is so large that any relative movement tendency that would lead to active and passive pressures is obscured. In analyzing such systems the soil deformation should be taken as the primary aspect of the method. These findings has lead to the development of a new method of analysis, the “shear ring” method. This is presented in the companion paper (Ref. 18).
ACKNOWLEDGMENT
The results presented in this paper are part of the research and development work conducted under the Soil-Structure Interaction Project sponsored by the U.S. Army Corps of Engineers, Civil Works Research and Development, Structural Engineering Program. Permission was granted by the Chief of Engineers to publish this information.
APPENDIX I. DERIVATION OF EQ. 4
Equation 4, which relates the initial modulus Gi to the secant modulus at mid-point, half way to failure, G50 is found as follows. The undrained incremental shear stress-strain relation for the nonlinear model, where the degree of shear strength mobilization becomes f = t/cu, is
 |
(I.1) |
The corresponding shear stress-strain relationship can easily be found by recalling that G is the slope (tangent modulus) of that relationship (i.e., G = dt/dg). By integration, using Eq. (I.1), yields
 |
(I.2)
|
For an incompressible material, Gi = Ei/3 and, in an undrained triaxial condition, e = 3e1/2, where (1 is the major principal (vertical) strain. Hence, Eq. (I.2) may be written as
 |
(I.3) |
At 1/2 of the failure stress, f = 1/2, the strain becomes, by definition, ( = E50; and 1/e50 = E50/cu, then
 |
(I.4)
|
REFERENCES
1. D'Appolonia, D. J., H. G. Poulos, and C. C. Ladd, “Initial Settlement of Structures on Clay.” J. of the Soil Mechanics and Foundations Div., ASCE, Vol. 97, No. SM10 (Oct 1971), pp. 1359-1377.
2. Dawkins, W. P., User's Guide: Computer Program for Soil-Structure Interaction Analysis of Sheet Pile Retaining Walls (CSHTSSI). Report to ADP Center, U.S.A.E. Waterways Experiment Station, Vicksburg, MS, 1982.
3. Dawkins, W. P., User's Guide: Computer Program for Analysis of Beam-Column Structures for Nonlinear Supports (CBEAMC). Instruction Report K-82-6, U.S.A. E. Waterways Experiment Station, Vicksburg, MS, 1982.
4. Desai, C. S., and H. J. Siriwardane, Constitutive Laws for Engineering Materials with Emphasis on Geologic Materials, Prentice-Hall, Inc., Englewood Cliffs, NJ, 1984.
5. Duncan, J. M., and C. Y. Chang, “Nonlinear Analysis of Stress and Strain in Soils.” J. of the Soil Mechanics and Foundations Div., ASCE, Vol. 96, No. SM5 (Sept. 1970), pp. 1629-1653.
6. Foott, R., and C. C. Ladd, “Undrained Settlement of Plastic and Organic Clays.” J. of the Geotechnical Engineering Div., ASCE, Vol. 107, No. GT8 (Aug 1981), pp. 1079-1094.
7. Holtz, R. D., and W. D. Kovacs, Geotechnical Engineering. Englewood Cliffs, NJ: Prentice-Hall, Inc., 1981, 733 pp.
8. Jackson, R.B., “E99 Sheet Pile Wall Field Load Test Report,” Technical Report No. 1, U.S. Army Engineer Division, Lower Mississippi Valley, June 1988, Vicksburg, MS
9. Janbu, N, “Soil Compressibility as Determined by Oedometer and Triaxial Tests.” Proc., European Conf. on Soil Mechanics and Foundation Engineering. Vol. 1. Wiesbaden, W. Germany, 1963, pp. 19-25.
10. Kulhawy, F. H., J. M. Duncan, and H. B. Seed, Finite Element Analyses of Stresses and Movements in Embankments During Construction. Contract report S-69-8. U.S.A.E. Waterways Experiment Station, Vicksburg, MS, Nov. 1969.
11. Leavall, D.A., J.F. Peters, E.V. Edris, and T.L. Holmes, “Develeopment of Finite-Element-Based Design Procedure For Sheet -Pile Walls,” Technical Report GL-89-14, USAE, Waterways Experiment Station, Vicksburg, MS, 1989.
12. Masing, G., “Eigenspannungen und Verfestigung beim Messing,” Proceedings of the 2nd International Congress on Applied Mechanics, Zurich, 1926.
13. Ngo, D., and A. C. Scordelis, “Finite Element Analysis of Reinforced Concrete Beams.” ACI Journal, Title No. 64-14 (Mar. 1967), pp. 152-163.
14. Oner, M., and N. Janbu, “Nonlinear Analysis of Foundation Vibrations.” Proc., 2nd Intl. Conf. on Numerical Methods in Geomechanics, Vol. 2. Blacksburg, VA, 1976, pp. 1025-1037.
15. Oner, M., W. P. Dawkins, and I. Hallal, Nonlinear Finite Element Analysis of Floodwall Structures, Report presented to U.S.A.E. Waterways Experiment Station, Vicksburg, MS, December, 1987.
16. Oner, M., W. P. Dawkins, I. Hallal, and C.C. Lai, Development of a New Method for Soil Structure Interaction Analysis of Floodwalls, Report presented to U.S.A.E. Waterways Experiment Station, Vicksburg, MS, December, 1988.
17. Terzaghi, K. “Evaluation of Coefficients of Subgrade Reaction.” Geotechnique, Vol. 5 (Dec. 1955), pp. 297-326.
18 Wilson, E. L. “Finite Elements for Foundations, Joints, and Fluids.” In Finite Elements in Geomechanics. G. Gudehus, Ed. New York: John Wiley & Sons, 1977.
19. Oner, M., W. P. Dawkins, and I. Hallal, Shear Ring Method for Soil-Structure Interaction Analysis in Floodwalls, The Electronic Journal of Geotechnical Engineering, ejge, Vol. 2, 1997.


